Diagram listing configuration
In the Project Environment dialog, in [library or project] > Diagram > Diagram Listing Configuration, the project administrator can define configurations that enable diagram designers to generate diagram object listings in Microsoft Excel format. P&ID can output listings in three different ways, as per the configuration: all objects in the same sheet, only one object per sheet (multiple sheets), or only one object per workbook file.
Creating a diagram listing template
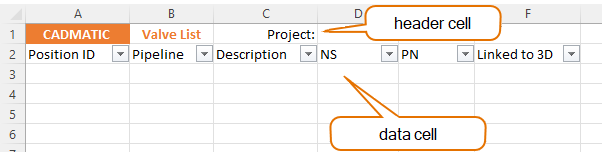
Create a Microsoft Excel template for use in diagram listing configurations. The template file can include header cells and data cells, which you can map in the listing configuration. This allows for automatic population of cells when a diagram designer generates a listing.
Do the following:
-
Use Microsoft Excel to create the template file.
 Show/hide details
-
Create a new spreadsheet file.
-
Determine the number of sheets your template file should contain. One sheet will suffice if the generated files are to contain only data sheets, and two sheets will be necessary if the generated files are also to include a summary sheet.
-
Design the layout of the template. A listing template can contain:
-
Static information such as your company name or logo.
-
Header cells.
-
One or multiple rows/columns of data.
-
Any special formatting: column filters, cell formatting (number, date…), fonts, background colors, cell borders, and so on.
-
-
Save the template in the file system.
-
-
Use the CADMATIC desktop to save the template in COS.
Show/hide details
-
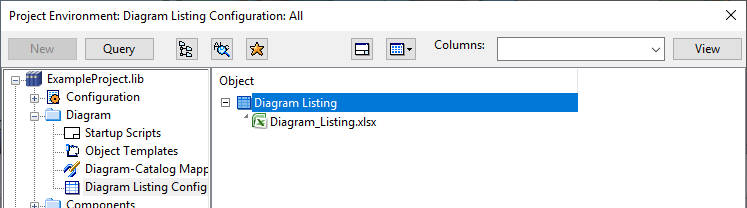
Select Object > Library and Project Databases. The Project Environment dialog opens.
-
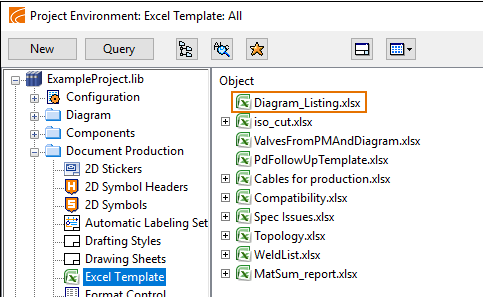
Browse to [library or project] > Document Production > Excel Template.
-
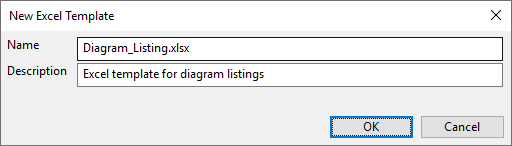
Select New > Excel Template, select the Excel file from the file system, and click Open. The New Excel Template dialog opens.
-
Enter a name and description for the template, and click OK. The new template is shown in the template list.
-
Creating a diagram listing configuration
Create a diagram listing configuration that determines what data is included in header and data cells when a diagram designer generates a listing. Header cells can derive their value from a PI_CATALOG column, a diagram COS object attribute, or a project COS object attribute. Similarly, data cells can get their value from sources such as a data request, an SQL database column, or a diagram object attribute.
Prerequisites
Do the following:
-
Use the P&ID application to create a new listing configuration.
Show/hide details
-
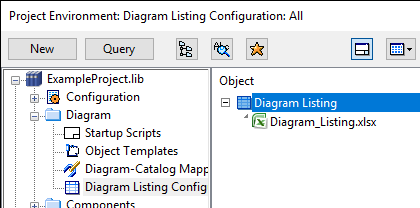
Select File > Environment > All library and project.
-
Browse to [library or project] > Diagram > Diagram Listing Configuration.
-
Select New > Diagram Listing Configuration. The Edit Object Attributes dialog opens.
-
Enter a name and description for the configuration, and click OK. The Listing Configuration dialog opens.
-
-
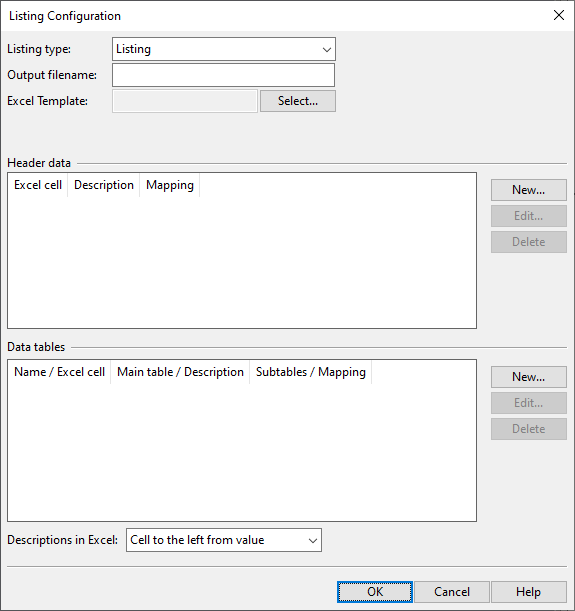
Define the general properties.
Show/hide details
-
Listing type – Choose the type of listings to create using this configuration.
-
Listing – This option creates a single Excel file where all objects are listed on the same sheet. You can sort the data by one or more columns. The default file name is the name of the Excel template.
-
Separate data sheets – This option creates a separate Excel file for each object, and the default file name is the name of the object.
-
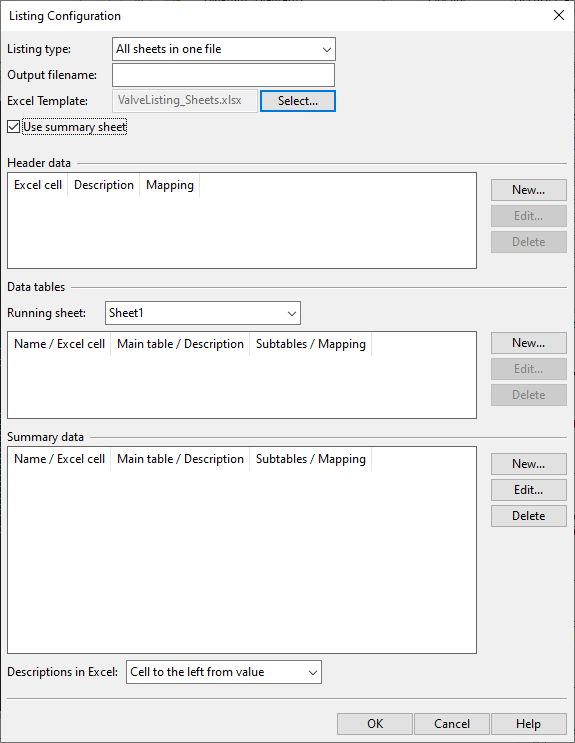
All sheets in one file – This option creates one Excel file where each object is on a separate sheet. The file name is always the Data table name defined in the Data Table Editor dialog, and the default sheet name is the name of the object.
-
-
Output filename – You can define a custom output name. This can be a combination of normal text, attribute tags (designated as {attribute:<tag>}), and main table and sub-table names (designated as {column:<maintable>.<subtable>}). Examples:
-
{attribute:.dU}
-
{column:PI_CATALOG.Name}_Rev-{column:PI_CATALOG.Revision}
Note: In listings of type 'Listing' and 'Separate data sheets', this customization impacts the name of the Excel file. In listings of type 'All sheets in one file', it influences the name of the Excel sheet. For data sheet outputs, establish a naming pattern that generates object-specific names.
-
-
Excel Template – Select the Excel template from COS.
-
Use summary sheet – This option becomes available if the Excel template contains more than one sheet. Selecting this allows an additional Running sheet option and an extra Summary data pane to appear in the dialog.
-
-
In the Header data section, define the data to be inserted into the header cells of the Excel file.
-
New – Opens the Excel Header Cell Configuration dialog for creating a new header cell mapping.
Show/hide details
-
Excel cell – Select the cell where the mapped data is to be inserted.
-
Click Pick. The Excel template (and a dialog for closing the template—do not click OK yet!) opens.
-
Select the cell where you want the data to be inserted.
-
Click OK in the separate dialog. The Excel template is closed.
-
-
Mapped to – Map the cell you selected from the template to a data source.
-
Click Map. The Select column dialog opens.

-
Select a column from the PI_CATALOG table, a diagram COS object attribute, or a project COS object attribute, and click OK.
-
-
Description – Enter a description for this mapping, and click OK.
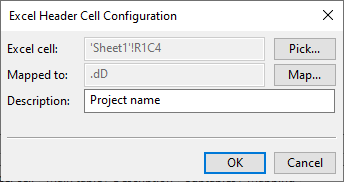
Note: This description is only shown in the Listing Configuration dialog. It is not inserted into the Excel file.
-
-
Edit – Opens the selected header cell mapping for editing.
-
Delete – Deletes the selected header cell mapping.
-
-
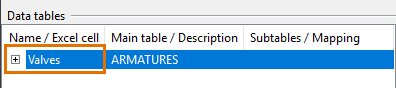
In the Data tables section, define the columns of data to be inserted into the Excel file.
-
Running sheet – If you chose to include a summary sheet in the generated files, this field lists the sheets of the template file. Select which sheet to use as the template for the data sheets.
-
New – Opens the Data Table Editor dialog for creating a new data request.
-
Edit – Opens the selected data request for editing.
-
Delete – Deletes the selected data request.
-
-
In the Summary data section (if enabled), define the data cells to be inserted into the summary sheet of the Excel file.
-
New – Opens the Data Table Editor dialog for creating a new data request.
-
Edit – Opens the selected data request for editing.
-
Delete – Deletes the selected data request.
-
-
The Descriptions in Excel setting allows the Description texts defined in Data Table Editor to be inserted into the data table (does not affect header cells).
-
Cell to the left from value – Insert the descriptions to the left side of the data.
-
Cell above value – Insert the descriptions above the data.
-
No descriptions – Do not insert descriptions to listings.
Note: If the Excel template already has something in the given cell, then the inserted Description value overwrites the template value. If the Description field is left empty, then the template's values are preserved.
-
-
Click OK. The new configuration is shown in the configuration list.
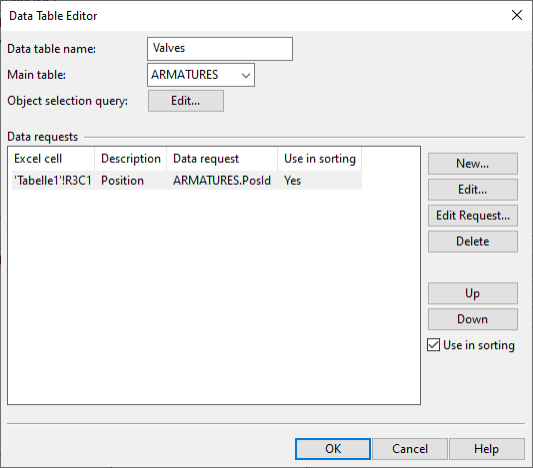
Data Table Editor
You can define which diagram objects and what object-specific data to include in the listings. If the listing is of type "Listing", you can also have the data automatically sorted in the output by one or more columns, in ascending order of the values.
Do the following:
-
In the Listing Configuration dialog, in the Data tables section, click New. The Data Table Editor dialog opens.
-
Define the general properties.
Show/hide details
-
Data table name – Enter a name for the data table. This name is displayed in the Listing Configuration dialog, and if the listing is of type "All sheets in one file" it is also used as the name of the Excel file.
-
Main table – Select the required main table: ARMATURES, EQUIPMENTS, INSTRUMENTS, ELECTRICS, SYSTEMS, PIPELINES, TAGS or CIRCUITS.
-
Object selection query – Click Edit to open the Selection Query Editor where you can define which sub-tables to include and create rules for selecting objects from those sub-tables.
-
-
In the Data requests section, define the data to be inserted into the columns of the table.
Show/hide details
-
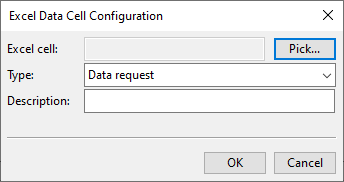
New – Opens the Excel Header Cell Configuration dialog for defining a new data mapping.
 Show/hide details
-
Excel cell – Select the Excel cell where the mapped data is to be inserted.
-
Click Pick. The Excel template (and a dialog for closing the template—do not click OK yet!) opens.
-
Select the cell where you want the data to appear.
-
Click OK in the separate dialog. The Excel template is closed.
-
-
Type – Select how to retrieve data into the data cell. The list of available options depends on the main table.
-
Data request – This option uses one or more data requests to retrieve values from the SQL or COS database. Additionally, the values can be processed prior to insertion into the Excel file. Closing the mapping dialog opens the Combined Data Requests for Label Definition dialog where you can define the data requests. A data request can change the format of the value, add a prefix or suffix to the value, and even combine several columns to one text output.
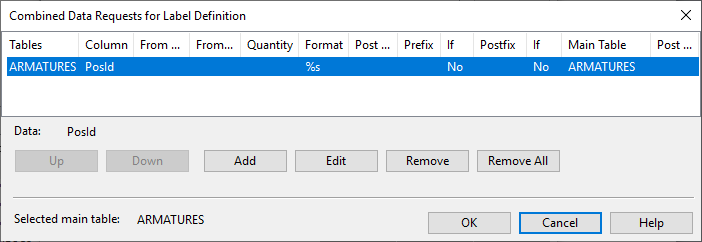
Note: You must use data requests if you want to map multiple data sources to a single data cell. For instance, this can be used to populate a specific column with values from different sub-tables. If the diagram object contains all targeted data fields, such as NS, NS2, and NS3, the retrieved values are consolidated in the data cell. However, if the diagram object only has one of the targeted data fields, like either ARMATURES.PosId or INSTRUMENTS.PosId, then only the value from that field is retrieved and displayed in the data cell. See also Diagram label definitions.
-
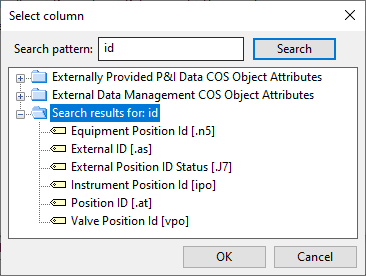
Attribute – Shows the value of a specific attribute in the data cell. Closing the mapping dialog opens the Select column dialog where you can select the attribute to be used.
Note: You cannot use the Attribute type to map multiple object attributes to a single data cell. To populate a column with values of multiple attributes, use the Data request type instead.
-
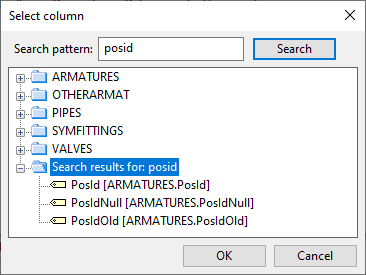
Column – Shows the value of a P&ID database column in the data cell. Closing the mapping dialog opens the Select column dialog where you can select the column to be used.
Note: You cannot use the Column type to map multiple database columns to a single data cell. To populate a column with values of multiple database columns, use the Data request type instead.
-
List of diagrams – Shows a semicolon-separated list of diagrams that contain the given object.
-
Pipeline from objects – Shows the object the pipeline is coming from.
-
Pipeline to objects – Shows the object the pipeline is going to.
-
Linked to 3D model – Shows whether the given object is linked to the 3D model via an EPD or EDM integration object.
Description – Enter a description for the mapped data.
Note: You can use the Descriptions in Excel function in the Listing Configuration dialog to insert this description into the Excel file. You can use this, for example, to overwrite some of the title cells defined in the Excel template.
-
-
-
Edit – Opens the selected data mapping for editing.
-
Edit Request – If the data mapping uses a data request, opens the data request for editing.
-
Delete – Deletes the selected data mapping.
If the listing is of type "Listing", you can select to sort the data table by one or more columns:
-
Use in sorting – Select this option to sort the data table by the values of the selected data mapping.
-
Up, Down – Define which columns are sorted before others. Sorting is applied to the data mappings from top to bottom—move the one that should be sorted first to the top of the list, and arrange the other ones in the desired sorting order.
-
-
When you have defined the required data mappings, click OK to close the editor.
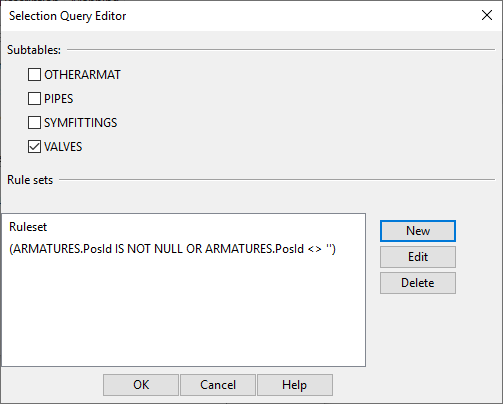
Selection Query Editor
You can specify which sub-tables to include when generating a diagram listing and define rule sets that an object must fulfill to be selected from those sub-tables. For example, only the VALVES sub-table, and from there only those valves that have a Position ID.
Do the following:
-
In the Data Table Editor dialog, in the Object selection query setting, click Edit. The Selection Query Editor dialog opens.
-
In the Subtables section, select which sub-tables to include when getting data for listings. (If there are no sub-tables, this section is empty.)
-
In the Rule sets section, define rule sets that select objects from the main table or the included sub-tables.
-
New – Opens the Selection Query Rule Set Editor dialog for creating a new rule set.
-
Edit – Opens the selected rule set for editing.
-
Delete – Deletes the selected rule set.
-
-
When you have defined the required rule sets, click OK to close the editor. The data request is displayed in the Data Table Editor dialog.
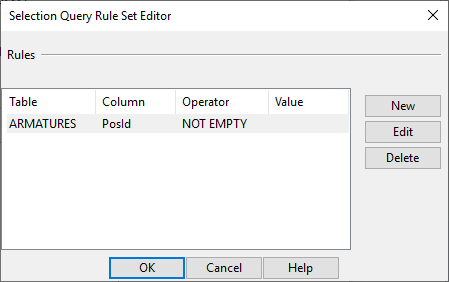
Selection Query Rule Set Editor
You can define a set of rules that an object must fulfill to be selected from a sub-table.
Do the following:
-
In the Selection Query Editor dialog, click New. The Selection Query Rule Set Editor dialog opens.
-
In the Rules section, define rules that select objects from a given sub-table.
-
New – Opens the Selection Query Rule Editor dialog for creating a new rule.
-
Edit – Opens the selected rule for editing.
-
Delete – Deletes the selected rule.
-
-
When you have defined the required rules, click OK to close the editor. The rule set is displayed in the Selection Query Editor dialog.
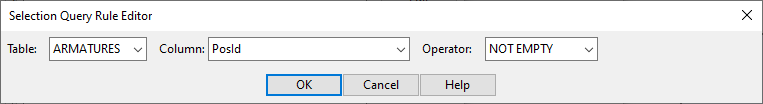
Selection Query Rule Editor
You can define a rule that an object must fulfill to be selected from a sub-table.
Do the following:
-
In the Selection Query Rule Set Editor dialog, click New. The Selection Query Rule Editor dialog opens.
-
Define a rule for selecting objects from a given sub-table.
-
Table – Select the sub-table from the list.
-
Column – Select the data column from the list.
-
Operator – Select the query operator from the list and specify the expected value (if applicable).
-
-
Click OK. The rule is displayed in the Selection Query Rule Set Editor dialog.
Example
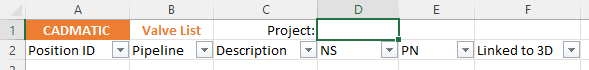
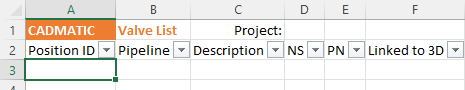
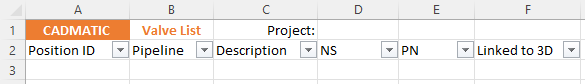
The template has a header cell for the project name and a number of columns for the object data:
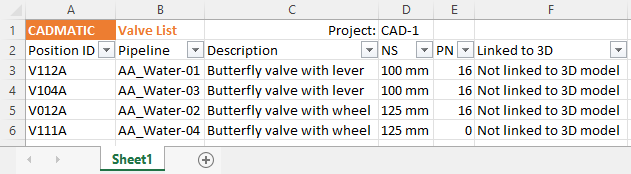
In the data mappings, the NS values are set to be sorted, and the values are retrieved using a data request that formats the value by removing digits and adding the unit:

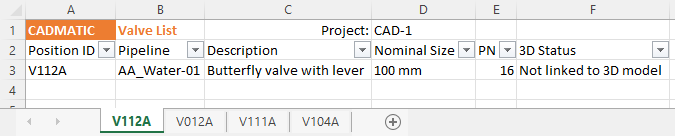
A listing of type "Listing", arranged by NS values:
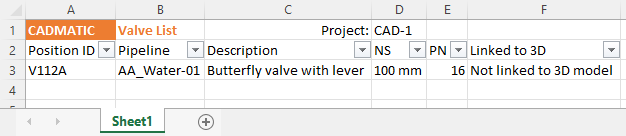
A listing of type "Separate data sheets":
A listing of type "All sheets in one file" with column headings (descriptions) defined in the data mappings: